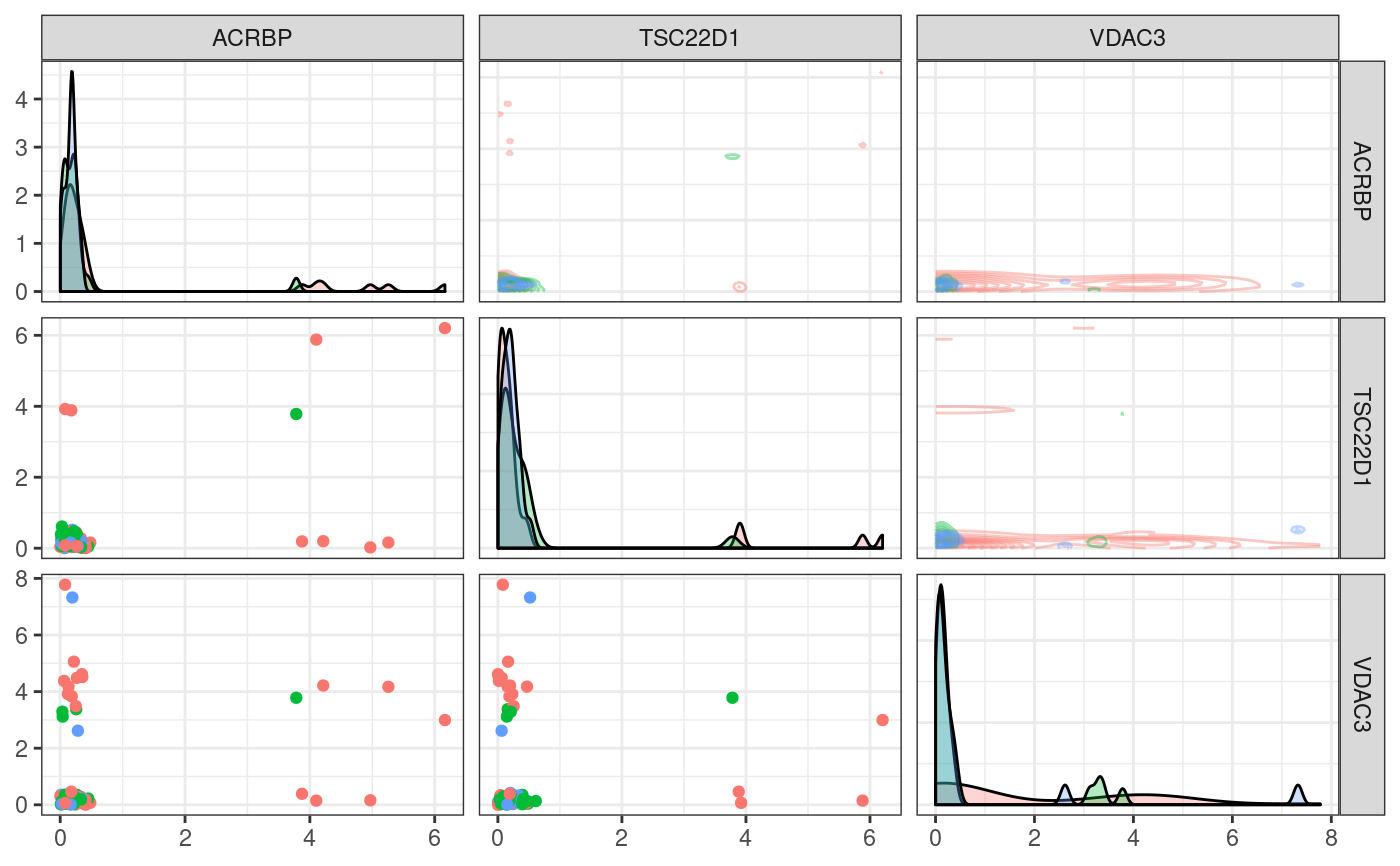
Plots data as faceted scatterplot emulating the ouput of flow cytometry
plot_flowstyle.RdSimulates flow cytometry plots for single cell rna seq data
plot_flowstyle(object, markernames, classif_col = "ident", ...)

# S3 method for data.frame
plot_flowstyle(
  object,
  markernames,
  classif_col = "ident",
  warn = TRUE,
  highlight_class = NULL,
  ...
)

# S3 method for Seurat
plot_flowstyle(object, markernames, classif_col = "ident", ...)
Arguments
| object | data, either a Seurat of a data frame object |
|---|---|
| markernames | names of the markers to be used for the plot |
| classif_col | name of the classification column to be used for the grouping, defaults to "ident" |
| ... | additional argumetns to be passed to GGally::ggpairs |
| warn | logical indicating if warninf should be shown, defaults to TRUE |
| highlight_class | a character indicating a class if it wants to be highlighted. ie "1" |
Value
a ggplot grid with the plots
Details
Note that it imputes a little bit of noise to values of 0 just for the Sake of visualization
Methods (by class)
data.frame: Draw a flowstyle plot from a data.frameSeurat: Draw a flowstyle plot from a Seurat object