autoplot.table
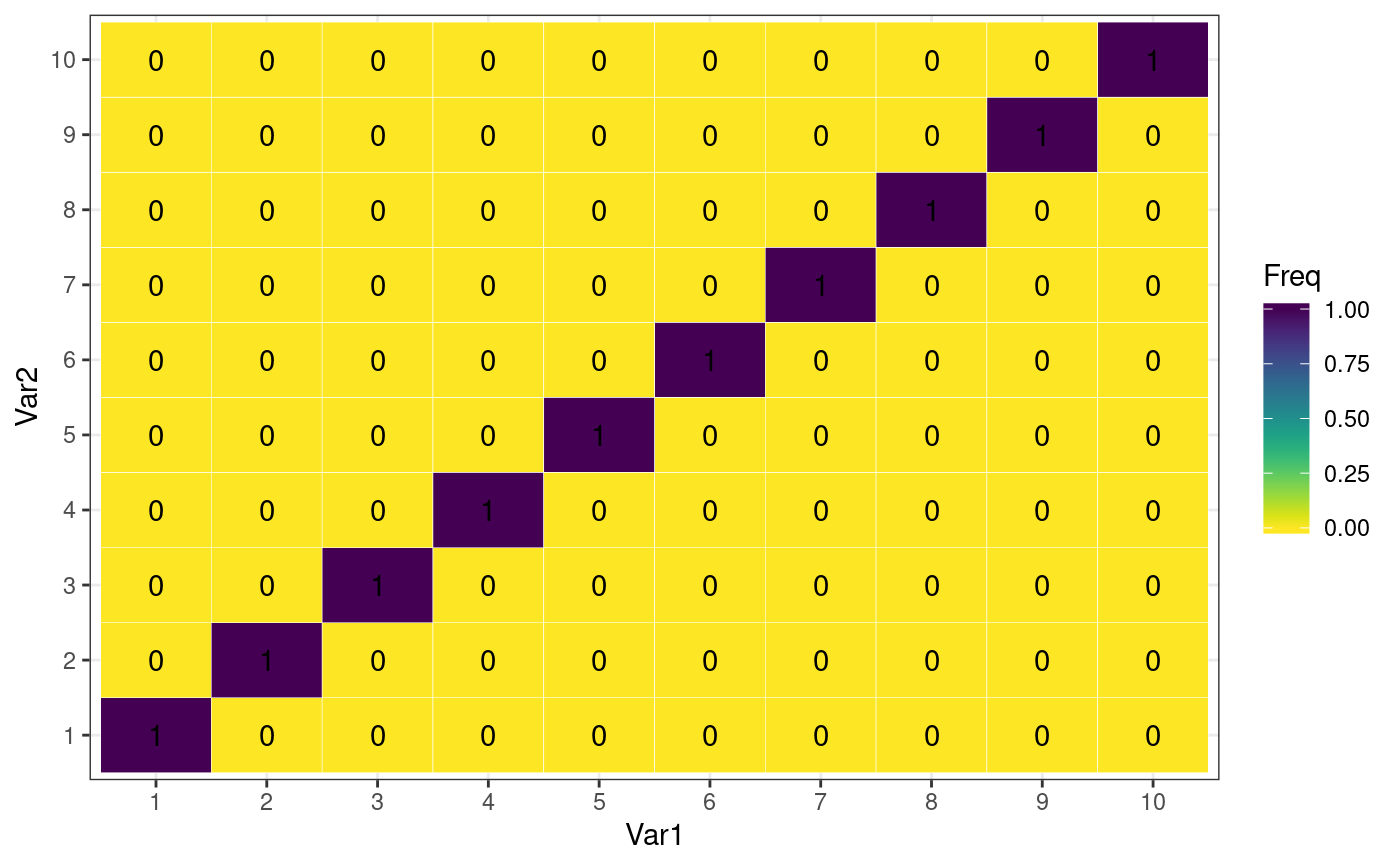
autoplot.table.RdHeatmap with ggplot from table objects
# S3 method for table
autoplot(object, min_color = NULL, show_number = FALSE, ...)

# S3 method for matrix
autoplot(object, ...)
Arguments
| object | a table object |
|---|---|
| min_color | minimum value to show colored, value sunder this will be shown as gray |
| show_number | logical indicating wether the number should be printed in the box of the heatmap |
| ... | additional arguments passed to downstream methods |
Value
ggpplot object
Methods (by generic)
autoplot: plot a matrix object as a heatmap using ggplot2
